
Key Promotional Product Statistics at a Glance
U.S. promotional product sales reached $27.1 billion in 2025, up 1.3%, while North American sales, including Canada, totalled $27.7 billion. Apparel remains the largest category, accounting for 26.6% of U.S. promo sales. 61% of consumers clearly remember the brand on their latest promotional item, 77% have looked up a brand after receiving one, and 72% have made a purchase because of a promotional product. Additionally, 76% are more likely to do business with an advertiser after receiving a branded item, while 87% would keep a promotional fleece or jacket for more than a year. A typical promotional item generates approximately 3,300 impressions over its lifetime, with an average cost per impression of just 0.6 cents.
How We Sourced These Statistics
We used primary sources only: trade associations, research firms and original survey publishers. Every stat carries its source and the year it was published. When studies disagree, we show both figures and explain the gap. Data published before 2021 is labeled "older data" so you can judge it.
Promotional Products Industry Size and Growth
The U.S. market is at a record high, but growth has clearly slowed.
US Promotional Products Industry Sales by Year
PPAI has tracked U.S. distributor sales since 1965. Here is the last decade.
Sales fell 19% in 2020, then passed the 2018 peak by 2022.
You will see 2026 figures like $27.45 billion or $27.8 billion online. PPAI has not published a 2026 dollar estimate yet. It usually releases each year's number the following January or February. So far, 60% of distributors expect higher sales in 2026. Until PPAI reports, $27.1 billion for 2025 is the latest verified U.S. figure.
Two more shifts stand out in PPAI's 2025 data. Online sales reached $7.1 billion, or 26.3% of the total. Retail-branded products grew fastest, reaching about $6 billion. PPAI also noted 2025 growth trailed inflation, so many distributors sold more but earned less.
Global Promotional Products Market Size
Grand View Research valued the global market at $90.5 billion in 2023. It forecasts 3.75% yearly growth, reaching $117.1 billion by 2030. The same report names North America as the largest region.
Treat global figures with caution, though. Other firms put the 2025 global market anywhere from $20.7 billion to $97.4 billion. A few global estimates are smaller than the U.S. market alone. That points to different definitions, not a shrinking industry.
Top Selling Promotional Product Categories
Apparel wins by a wide margin. T-shirts alone outsell every other single product.
ASI splits apparel into T-shirts, polos and other items. Here is its top five for 2024 sales.
PPAI groups all apparel into one bucket. Here is its 2024 top ten, with dollar estimates calculated from PPAI's shares.
ASI also reported that drinkware dipped slightly in 2024, ending three straight years of growth.
Which Industries Buy the Most Promotional Products
Schools and B2B service firms buy the most promotional products.
Education took first place in 2024. In 2023, B2B led, followed by education and healthcare.
By purpose, brand awareness leads at 22.5% of sales. Business gifts come second, at 14.9%.
One warning here. Some pages say retail buys 19.6% of all promo products. That 19.6% is PPAI's share for retail-branded products. Retail as a buying industry was just 3.3%.
Brand Recall Statistics
Most people remember who gave them a promo item. The exact share depends on the study.
How Many People Remember the Brand on a Promotional Product
The newest data comes from PPAI's 2025 survey of 1,000 U.S. consumers. 61% clearly remember the brand behind their most recent promo item. 57% said a clear, visible logo helped them remember. 44% said they saw or used the item often. And 38% still remember the brand months or years later.
You will also see 85% and 90% quoted. Both are real, but they measure different things.
The gap is mostly about prompts. People recall more brands when shown a list. Unprompted memory is the tougher, more honest test.
Watch for one common mix-up. PPAI's 2026 study says 90% feel promo improves their view of a brand. That is a perception stat, not a recall stat.
Brand Recall by Product Type
ASI's 2026 edition does not publish recall by product type. The most recent category data is older, so treat it as a guide.
- Shirts and hats: 85% recall the advertiser who gave them one. ASI, 2019, older data.
- T-shirts: 81% to 95% recall the advertiser, depending on region. ASI, 2016, older data.
- Health and safety items: 82% can immediately name the advertiser. ASI, 2016, older data.
The pattern holds across editions. Items worn or used in public are remembered best.
Purchase Intent and Customer Loyalty Statistics
Promo items nudge buying decisions. How big that nudge looks depends on the question asked.
How Promotional Products Affect Buying Decisions
Published figures for "more likely to do business" range from 20% to 92%. Here is where each number comes from.
ASI's 2023 and 2026 product ranges differ sharply. Its public reports don't explain why. So compare products within one edition, never across editions.
The 72% figure is arguably the most useful. It asks about past purchases, not future intentions.
Promo also sends people searching. 77% looked up a brand after receiving an item, per PPAI in 2025. PPAI's 2017 study found 79%, rising to 87% among millennials.
Which products move people most? Here is ASI's 2026 U.S. data.
Food gifts and blankets top both lists. T-shirts sit near the bottom, even though people want them most.
Promotional Products and Customer Loyalty
Promo builds goodwill, and goodwill feeds loyalty.
- 78% have a more favorable view of an advertiser after receiving an item. ASI, 2026.
- 90% say a promo item improves their view of the brand, and 83% feel appreciated. PPAI, 2025, 5,000+ U.S. respondents.
- 72% link branded merch with pride, belonging or gratitude. PPAI, 2025.
- 36% feel emotionally connected to a brand because of a promo product. PPAI, 2025.
- 54% said they would definitely or probably grow more loyal after receiving promo. PPAI, 2017, older data.
How Long People Keep Promotional Products
Promo items tend to stick around. Wearables and practical items last longest.
- 65% are very likely to keep a branded item for six months or longer. PPAI, 2025.
- 54% still have the last promo item they received. PPAI, 2025.
- 48.7% kept promo products for over five years. PPAI, 2021, 5,674 U.S. and Canadian consumers.
Average Time Kept by Product Type
ASI last published average months kept in 2019. Its 2026 edition reports the share kept at least a year instead. The table shows both.
In 2019, the average across all items was about one year. In 2026, half of consumers said they'd keep a promo blanket for over five years.
Why People Keep or Throw Away Promotional Items
Usefulness decides almost everything. Quality and design come next.
These are the top reasons people keep a promo item, per ASI's 2026 study:
- Useful to have: 78%
- Enjoyable to have: 43%
- Attractive: 42%
- Handy for contact details: 19%
PPAI's 2025 study adds more detail. 68% keep items they will actually use, and 68% keep items with high-quality materials. 44% prefer subtle branding. 89% say design affects whether they keep something. 52% keep items for sentimental value.
Here is why items get tossed or forgotten, per the same PPAI study.
Unwanted items often get a second life. When people don't want a promo item, 55% give it to someone else. Only 23% throw it away, and 21% keep it anyway. That is ASI data from 2019, so it is older. PPAI's 2019 study also found 79% pass on items that no longer feel valuable.
Promotional Product Impressions and Cost Per Impression
Promo items keep working long after the handoff. Every sighting counts as an impression.
Lifetime Impressions by Product
ASI estimates impressions by multiplying three things. How long someone keeps the item, how often they use it, and how many people see it.
Here is how the numbers changed across ASI's last three editions.
Rankings shift a lot between editions. Always quote the edition year with the number. The steady winners are wearables and bags.
Cost Per Impression Compared to Other Advertising
Cost per impression is simply what you pay each time someone sees your brand.
To get it, divide the item's cost by its lifetime impressions. A $6 tote bag with about 5,000 impressions works out to roughly 1/10 of a cent per view.
How does that compare with other media? ASI's newest report ranks promo first in consumer opinion. But it doesn't publish updated costs for TV or digital. The last side-by-side figures we could verify date from 2008.
ASI's 2014 update found the same pattern. At about half a penny per impression, promo beat prime-time TV, magazines and newspapers. It roughly matched spot radio and online ads.
Consumers also like promo more than other ads. 75% of U.S. consumers view promo positively, a higher share than TV, internet, mobile or social ads.
Most Popular Promotional Products in 2026
What people own and what they actually want are two different lists.
Most Owned Promotional Products
ASI last published ownership rates in its 2019 edition. Pens and drinkware were nearly universal.
The average U.S. household owned 30 promo items, per the same ASI study.
PPAI's 2021 survey of 5,674 consumers found similar leaders. 72.8% had received promo writing instruments. 68.4% had magnets and 57.6% had office supplies.
Promotional Products People Most Want to Receive
Asked what they'd be most excited to receive, U.S. consumers picked these in 2026.
Jackets, food gifts and blankets are wanted far more than they are bought. ASI flags this as a gap worth exploring for holiday and appreciation gifts.
Promotional Product Trends for 2026
PPAI's 2026 research points to six clear shifts. Each one is backed by a number.
- Fewer, better items. When budgets tighten, 60% of buyers cut quantity first. Only 11% cut customization.
- Retail-style design. 78.7% of top distributors see rising demand for better-designed, retail-style products. Retail-branded sales hit about $6 billion in 2025.
- Durability as the value test. 70.4% of distributors say durability is the strongest signal of value. Modern design came next, at 65.2%.
- Personal touches. 48% say personalization makes an item more memorable. Another 48% value a short personal message.
- Sustainability with proof. 34.4% of suppliers report more requests for testing, PFAS disclosure and ESG documents.
- Drinkware levels off. 73% use branded bottles or tumblers daily. Yet ASI reported drinkware sales dipped slightly in 2024.
What Gen Z and Millennials Want in Branded Merchandise
Gen Z uses promo often and expects it to look like retail. PPAI surveyed 500+ U.S. consumers aged 18 to 26 in 2024.
- 63% rank apparel as their favorite promo category. Fashion accessories follow at 57%.
- 34% use promo products weekly, and 21% use them daily.
- 63% have bought something because of a promo item.
- 51% follow brands specifically for their merch or giveaways.
- 89% say sustainability matters, and 85% want items to feel on-trend.
- Personalization matters to 85% of Gen Z, versus 39% of all consumers.
- 90% would recommend brands that give high-quality promo products.
Millennial data is thinner and older. In PPAI's 2017 study, 87% of millennials looked up a brand after receiving promo. 48% kept items because the design fit their style. Both figures are older data.
At work, preferences line up. A 2024 survey of 5,000 employees found Gen Z and millennials both ranked sweatshirts and jackets as their top two favorite gifts.
So what swag does Gen Z like? Quality apparel with retail-style logos, made responsibly and ideally personalized.
Branded Apparel and Custom Sock Statistics
Apparel is promo's biggest category, and it earns the most impressions per item.
Wearables made up 26.6% of U.S. promo sales in 2024, about $7.1 billion. T-shirts alone brought in $4.3 billion, and polos $2.5 billion, per ASI.
Apparel keeps working after the handoff. Fleece and jackets earn 9,000 lifetime impressions, the most of any category. 90% of people wear a promo T-shirt at least monthly. 78% wear promo fleece at least once a week.
Recall is strongest for apparel too. ASI's 2019 edition found 85% recall who gave them a shirt or hat. That is older data, but no newer edition contradicts it.
What about socks specifically? No trade body publishes a sock category figure yet. PPAI files footwear under fashion accessories, at 4.9% of 2024 sales. That bucket also includes sunglasses, aprons, gloves and beanies. ASI's 2026 study doesn't measure socks at all.
There are early signals, though. PPAI's Expo 2026 coverage quoted a franchise distributor's vendor lead calling custom decorated socks a hit on the show floor.
One honest caution. A 2024 survey of 5,000 employees found footwear was the most disliked work gift, at 62.2%. The survey pointed to strong personal preferences around socks and shoes. The fix is simple: keep designs wearable, get sizing right and ask first.
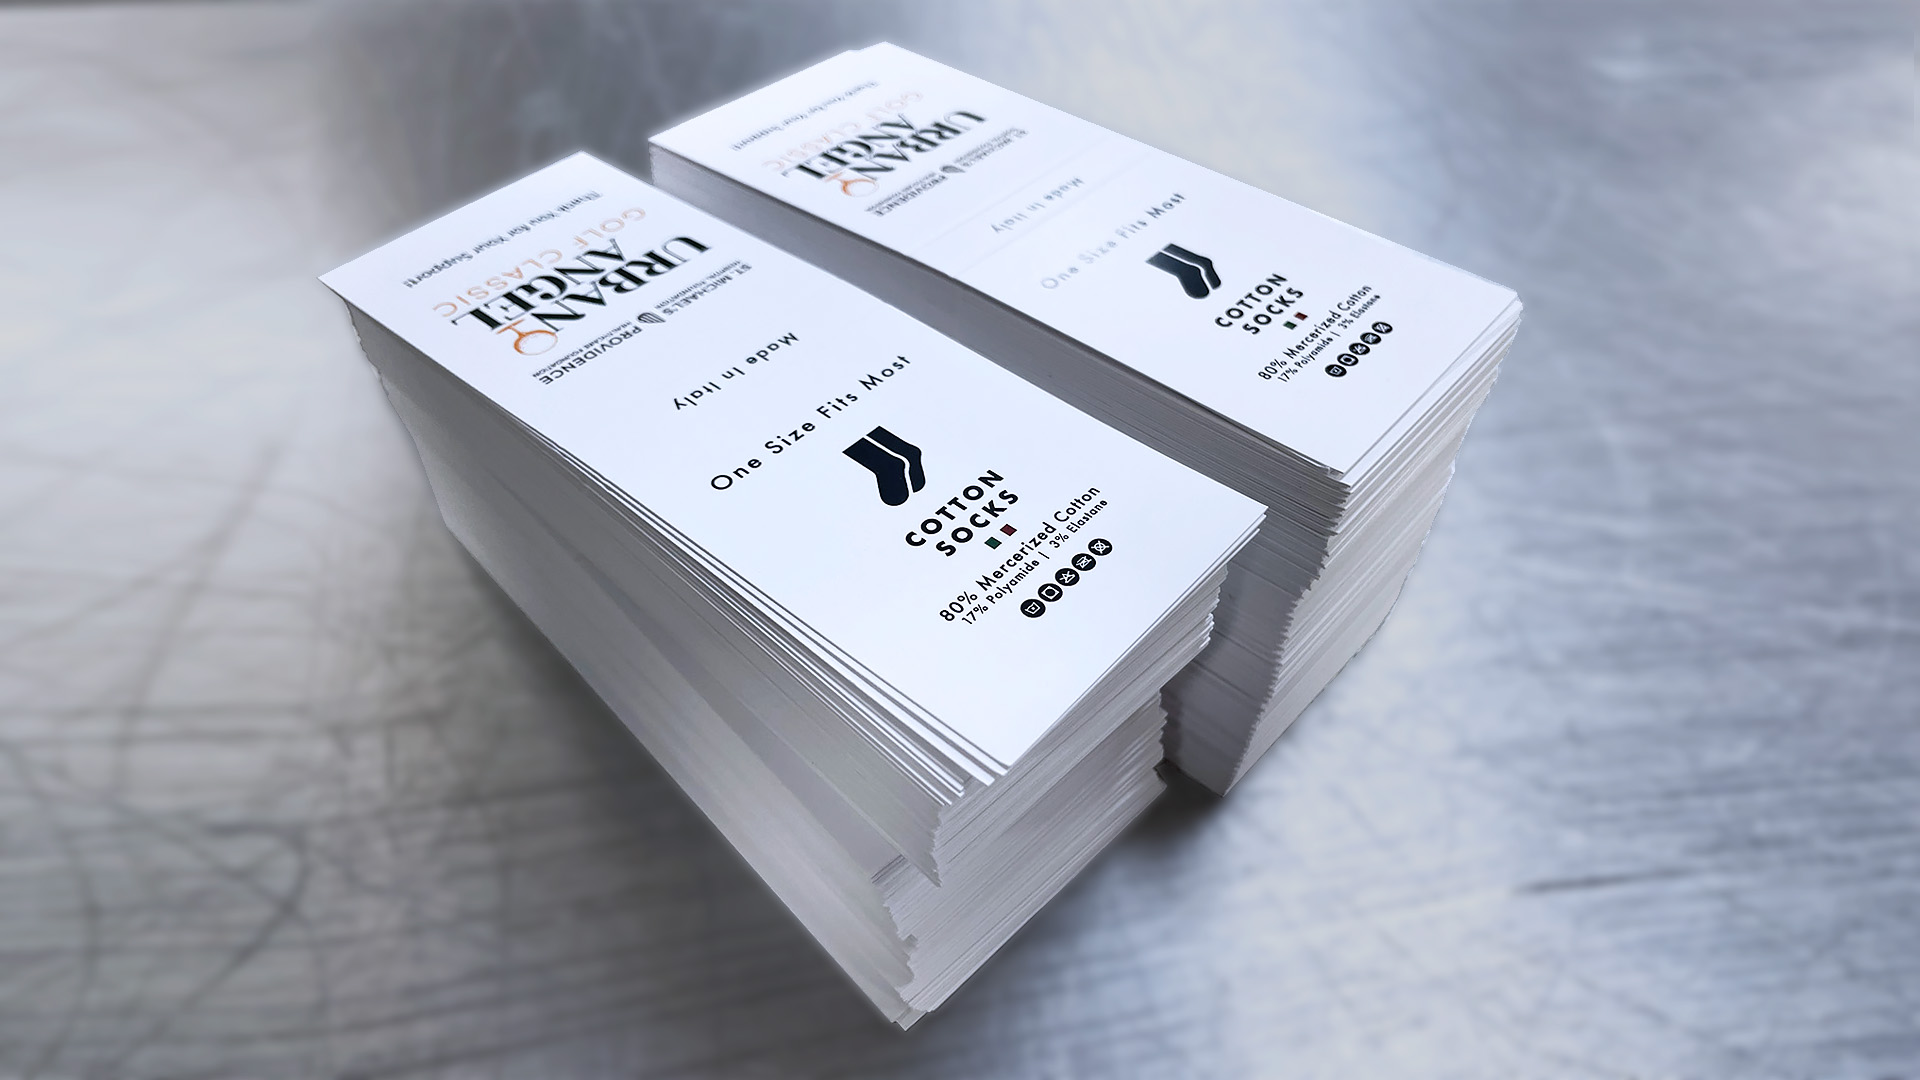
Most corporate sock programs avoid sizing trouble with one-size-fits-most styles, like these personalized crew socks. A knit-in logo also won't fade or peel, which matters for items worn weekly.
Curious where demand runs hottest? See the states most obsessed with custom socks. Our own order data is in the Sockrates section below.
Employee Swag and Workplace Statistics
Employee swag is a big slice of promo spending, and staff notice it.
Employee programs made up about 16.4% of 2024 U.S. promo sales. That covers employee relations at 9.1% and incentives at 7.3%, per PPAI. By our math, that is roughly $4.4 billion.
The best workforce data comes from vendor-run surveys, so treat it as directional.
- 73% of employees say company swag adds to belonging or pride. Survey of 5,000 full-time U.S. employees, 2024.
- 69% wear or use company-branded items outside work, per the same survey.
- 61% still use promo items from previous employers.
- Swag recipients stayed 1.5 years longer on average. That is a correlation, not proof that swag caused it.
- 87% feel proud of their company when wearing its swag, and 79% feel closer to colleagues. Employee gifting platform study, 2026.
- Only 30.5% said their last swag was exactly what they would pick. 14.1% didn't want it or keep it. Study of 2,500 North American employees, 2026.
- 44.2% at companies with 250+ staff got no welcome kit at all. Same 2026 study.
That last gap is an easy win. If you are building onboarding kits, these new employee welcome gift ideas are a practical start. For remote teams, shipping swag straight to home addresses saves a lot of hassle.
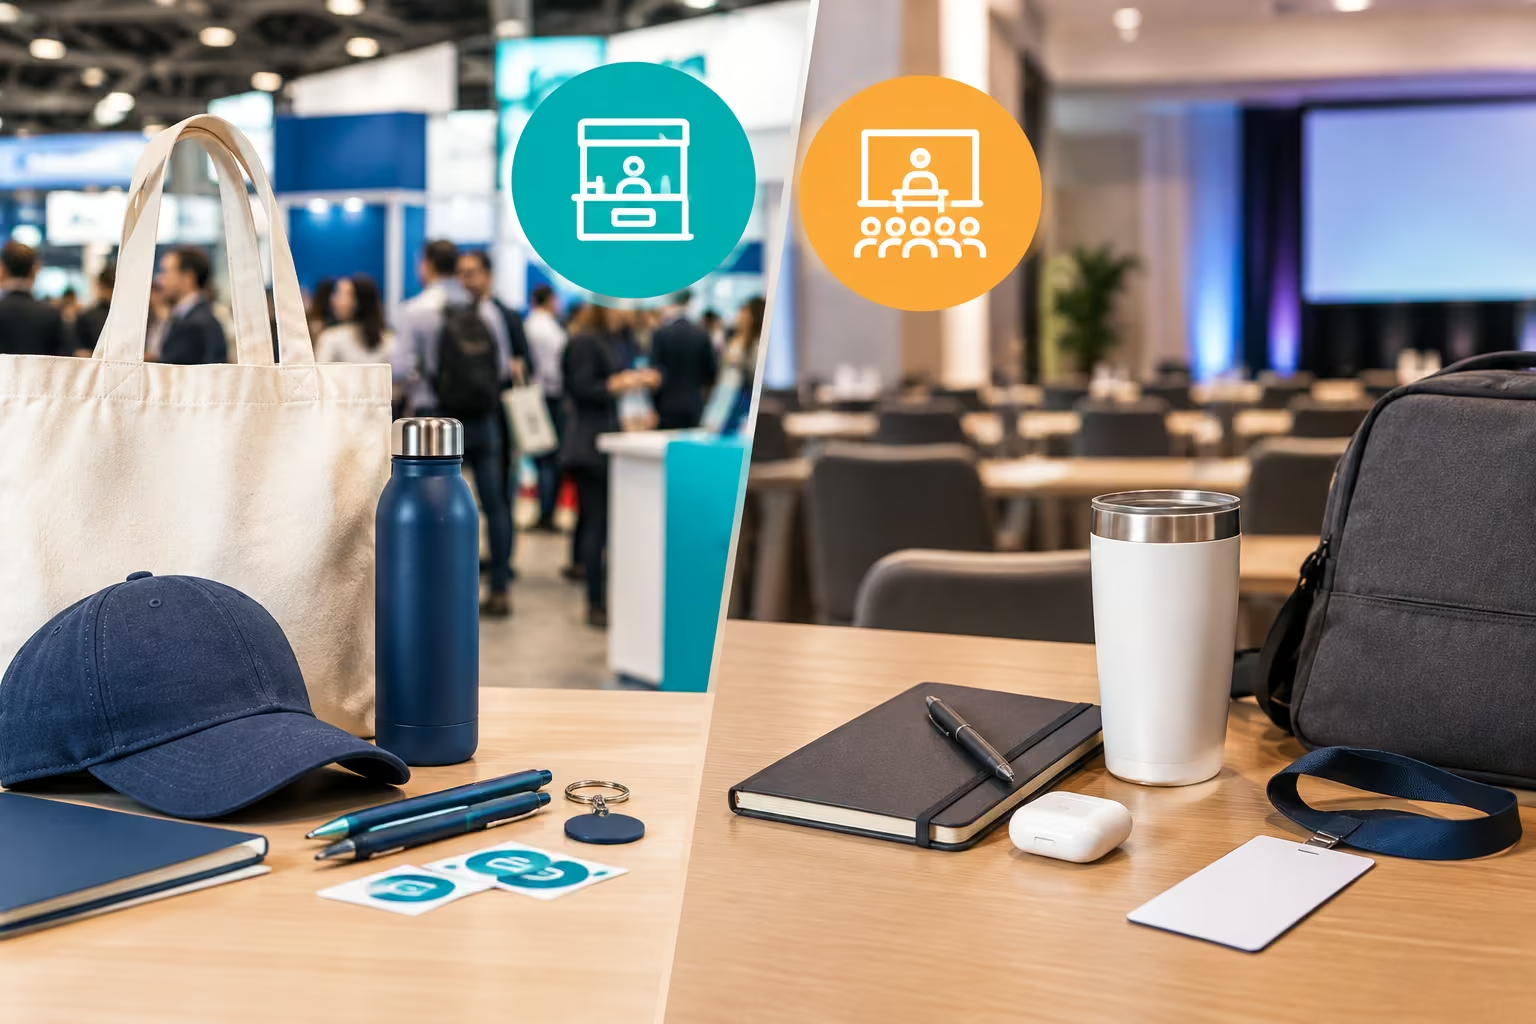
Trade Show and Event Giveaway Statistics
Trade shows are a core use for promo, but booth swag faces the most skepticism.
- Trade show programs made up 9.3% of U.S. promo sales in 2024, about $2.5 billion by our math.
- Attendee quality is high. A CEIR study found 94% of attendees have net buying influence. They specify, recommend or make the final decision. Reported in 2013, so it is older data.
- The widely quoted "81% have buying authority" traces to an older CEIR report. We couldn't open the original, so we can't confirm its date or wording.
- Figures for attendees who aren't current customers vary widely. Roundups cite 64%, 67% and 76%, with no primary report we could access.
- Gen Z is receptive. 38% like receiving promo at events or trade shows, per PPAI in 2024.
- Bags travel the whole show floor. 92% use a promo bag at least monthly, and bags earn about 4,900 impressions each.
The most overused giveaways are simply the most common ones. In PPAI's 2021 survey, 72.8% had received promo pens and 68.4% had received magnets. In 2025, 37% said an item felt forgettable because they owned too many similar ones.
Skepticism is growing too. 31% of distributors worry about anti-swag attitudes among clients, up from 23% a year earlier.
Want booth items people actually take home? Browse these trade show giveaway ideas and conference giveaways.
Sustainable and Eco-Friendly Promotional Product Statistics
Sustainable promo is now standard, but buyers rarely ask for proof.
Sustainable sales jumped 20% in 2024, then grew about 3% in 2025. That 3% is our math from PPAI's rounded figures. PPAI now calls sustainability a standard offering, not a fast-growth category.
Consumers say it matters to them:
- 76% say sustainability affects whether they keep or use an item. PPAI, 2026.
- More than 62% prefer items made from recycled or eco-friendly materials.
- 74% view an advertiser more favorably after receiving a sustainable item. 79% say the same for Made in USA items.
- 89% of Gen Z call sustainability important. PPAI, 2024.
Yet buyers rarely ask for it:
- Only 33.3% of distributors say clients regularly ask for sustainable options.
- Just 17.5% of suppliers call sustainability a top buyer priority.
- Still, 34.4% of suppliers see more requests for testing and ESG paperwork.
Proof now matters more than green claims. Ask suppliers for certifications and material details. For socks, that could mean GOTS-certified organic cotton. Our sustainability page covers the audits, dyes and materials behind each pair.
What Doesn't Work: Wasted and Discarded Swag
Not all swag works. Some of it goes straight in the bin.
How much? When people don't want a promo item, 23% throw it away. Most give it to someone else instead. That is ASI data from 2019, so it is older.
Some items get binned far more often than others.
Employee swag misses too. A 2026 study found more than half of employees rarely or never use their last swag, or no longer have it.
You may have seen "7 in 10 promo items end up in landfill." We found no source for it. See the table in the next section.
Distributors interviewed by ASI describe a clear pattern. Critics hate cheap conference swag left behind in hotel rooms. One-per-attendee giveaways get tossed fastest. Fewer, nicer items on the same budget get kept.
Three simple ways to avoid waste:
- Order fewer, better items. Keep the budget, but give to a tighter list.
- Pick things people use weekly, like apparel, bags or drinkware.
- Keep logos small and design strong. Loud branding puts off 26% of recipients.
Promotional Product Stats You Should Stop Quoting
Some promo stats keep circulating long after anyone checked them. Here is what we found when we traced them.
Spotted another shaky stat? Send it our way and we will trace it.
What Our Custom Sock Orders Show (Sockrates Data)
Sockrates has made custom socks for more than 5,000 brands. Here is what our orders show.
- Most popular sock style: Dress crew socks, 65% of orders (followed by athletic crew at 25%, misc 10%)
- Most common use case: Trade shows, 60% of orders
- Average order size: 250 pairs
- Busiest ordering months: October, November, January, and March
- Top ordering industries: Tech, Banking, Insurance
- Most requested add-on: Header labels, 98% of orders (bands 1.5%, custom boxes 0.5%)
How to Measure the ROI of Your Promotional Products
You don't need fancy tools to measure promo ROI. You need a goal, a tracker and a comparison group.
- Set one goal. Pick leads, demo bookings, event sign-ups or repeat orders.
- Add a tracker. Use a QR code, vanity URL or promo code. On socks, put it on the header card or packaging, not the sock.
- Hold back a control group. Keep a small, similar group that gets no item.
- Track over a set window. Thirty days works for most campaigns. Use 90 days for long B2B sales cycles.
- Compare costs. Check cost per lead or customer against your normal target.
Use these three formulas:
Extra conversions = (test rate - control rate) × test group size
Cost per extra conversion = total cost ÷ extra conversions
ROI % = (revenue from extra customers - total cost) ÷ total cost × 100
Worked example. These numbers are for illustration only.
- You send custom socks to 250 prospects. Another 50 similar prospects get nothing.
- Socks cost 250 pairs × $12 = $3,000. Inserts and postage add $500, so total cost is $3,500.
- Within 30 days, 40 of the 250 book a demo. That is 16%.
- Only 4 of the 50 control prospects book one. That is 8%.
- Extra demos = (16% - 8%) × 250 = 20.
- Cost per extra demo = $3,500 ÷ 20 = $175.
- Five of those 20 become customers, worth $2,000 each in year one. That is $10,000.
- ROI = ($10,000 - $3,500) ÷ $3,500 × 100 = about 186%.
For more planning help, see how to use promotional products effectively.
How to Use These Statistics in Your Next Campaign
- Choose useful over clever. 78% keep promo items because they are useful. Novelty rarely survives the drawer clear-out.
- Spend on quality, not quantity. 62% say poor build makes an item feel cheap. Cheap items can hurt the brand on them.
- Pick wearables for reach. Fleece and jackets earn 9,000 impressions, and T-shirts 3,500. Apparel also leads recall.
- Keep the logo subtle. 44% prefer subtle branding, and 26% dislike oversized logos.
- Personalize when you can. 48% say personalization makes an item more memorable. A name or short note is enough.
- Measure every run. 72% say they bought because of a promo product. A code or QR tells you if yours did.
Frequently Asked Questions
Create socks your team will actually be proud to give away





.webp)